How maps are guiding solutions to the biodiversity crisis
Effectively extending wildlife protections depends on knowing exactly where conservation is needed—and, importantly, how exactly to ensure that conservation is effective.
By WP Creative Group
February 16, 2023
The variety of life on the planet is declining faster than ever. Scientists warn that the damage to ecosystems caused by human activity can, among other impacts, worsen the effects of climate change globally and threaten humanity’s food and water supplies. But in December 2022, after two years of covid-related delays and two weeks of intense negotiations, the world finally achieved a once-in-a-decade deal to halt the devastation, the Kunming-Montreal Global Biodiversity Framework.
The agreement, signed by nearly 200 countries, could bring major changes to conserving vital species. In the United States, for instance, about 13 percent of land and water is permanently protected and managed for biodiversity. The Biden administration has committed $375 million to increasing that number to 30 percent by 2030, part of a larger global push known as “30 by 30,” to protect more wildlife worldwide.
For anyone focused on protecting nature, the questions are where and how to do this work. The answer to both begins with building better maps.
“Maps have been a kind of language for human beings for thousands of years,” Jack Dangermond, president and founder of Esri, the world’s leader in geographic information systems (GIS), said during a recent Washington Post Live event. Esri has built an array of tools to locate and measure biodiversity and develop ever-smarter conservation measures.
Building the most detailed map of American biodiversity
The Map of Biodiversity Importance (MOBI)—an effort backed by NatureServe, state partners, Esri and the Nature Conservancy (TNC)—offers an unprecedented picture of wildlife in the United States. Designed using models detailing more than 2,200 species, where they are known to exist and their habitat needs, the map provides more evidence that hundreds of critically imperiled species have no protection under federal or state law. And even when these species are protected, many exist outside of protected lands.
By combining the MOBI data with land use and climate change models, researchers can calculate a conservation return on investment for the most endangered species and landscapes. The hope is the maps will identify win-win solutions for conservation, agriculture and industry, bridging long standing gaps between nature and people.
“This is the power of geographic information coming together,” Dangermond explained, “communicating with decision makers so that they can better understand and act.”
Bringing California’s conservation goals into focus
In California officials have also pledged to achieve 30 by 30, with a sweeping $768 million plan to protect six million acres of land and half a million acres of water. But with a desperate need for new housing and infrastructure in the state—and a complex web of public and private stakeholders—this won’t be easy.
To help meet this ambitious, first-in-the-country commitment, the California Natural Resources Agency worked with Esri to develop CA Nature, an interactive mapping hub to give anyone—state and federal agencies, land trusts, corporations and citizens—deeper insight into the state’s natural heritage and improve conservation decisions.
Powered by rich geospatial data drawn from a wide array of state agencies along with federal data from Esri’s ArcGIS Living Atlas of the World, the hub can highlight palatable, nature-based solutions for landowners, communities and other stakeholder groups. A prime example is the spot where California Governor Gavin Newsom announced the state’s roadmap: the groundbreaking of the world’s largest wildlife crossing, the Wallis Annenberg Wildlife Crossing. The crossing will span 10 lanes of Highway 101 and an adjacent road, providing a vital bridge for mountain lions and other Santa Monica Mountain wildlife to roam safely between two large areas of habitat, without the threat of vehicle collisions. The crossing, set to be completed in 2025, will bring badly needed upgrades to local infrastructure while ensuring the survival of many isolated species.
Learning from an ecosystem “twin”
Some of the very first maps TNC created decades ago using GIS technology marked an area of land on California’s Point Conception—one of the last remaining stretches of wild coast in California—as a priority for protection. Five years ago, with support from Jack and Laura Dangermond, the organization purchased and conserved this 25,000 acre coastal area, now called the Jack and Laura Dangermond Preserve, and have been turning it into a living learning laboratory for conservation science.
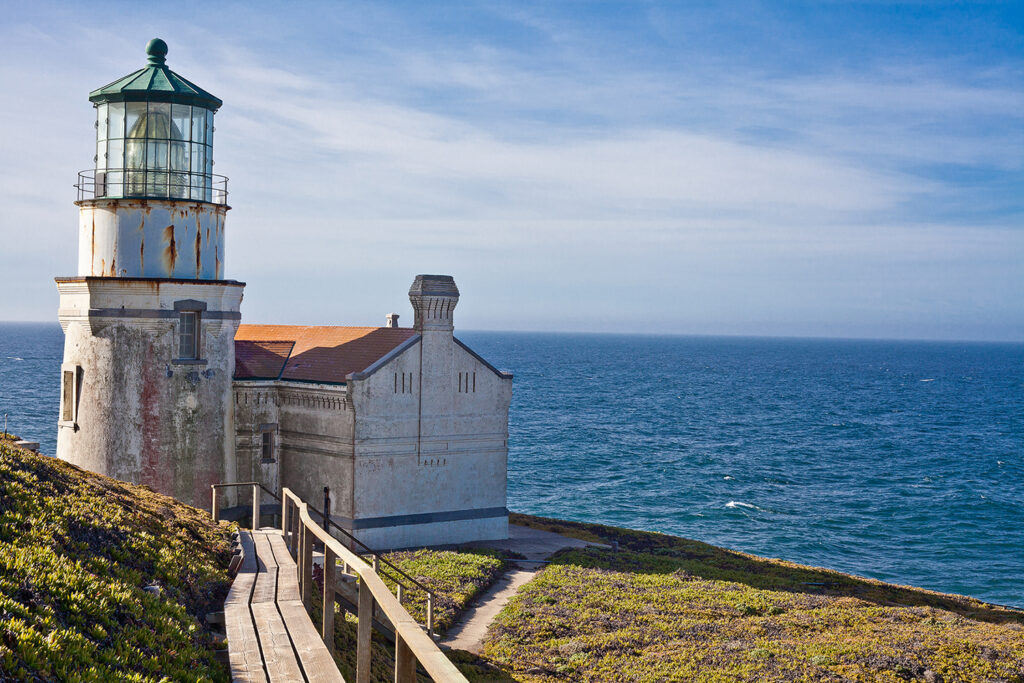
Researchers at the preserve leverage a GIS-powered, real-time map of the environment, also called a “digital twin,” to derive crucial learnings from the last coastal wilderness in California. Freshwater at the reserve is very limited, for instance, so hydrologists turned 22 groundwater wells into a sensing network to monitor groundwater movement and recharge rates. The maps created from this data drive an early warning system for ecosystem threats, inform long-range planning at the preserve and provide lessons for conserving other arid, Mediterranean-type coastal areas around the world.
Maps are helping specify where and how to achieve the important, but arduous work of minimizing the destructive impacts of the human footprint on biodiversity. Dangermond summed it up: GIS can “give us guidance to bring all of our science together, all of our thinking together, all our design thinking together so that it can be a framework for positive change.” Positive change for the planet and all of its inhabitants.

Learn more about how Esri’s GIS technology helps with biodiversity preservation and more of the world’s most complicated issues.