How maps protect the future of our planet’s biodiversity
Geographic information system (GIS) technology provides a clear picture of where plant and animal species are at the greatest risk of extinction—and help guide conservation actions to protect them.
By WP Creative Group
December 20, 2023
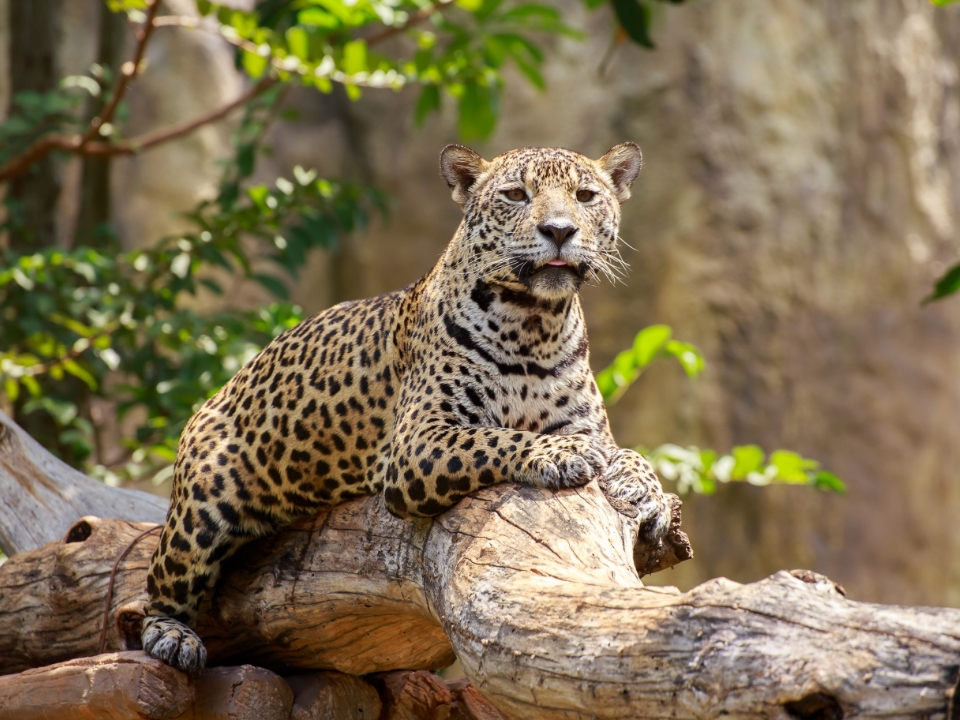
The jaguar cubs that first appeared on a camera trap in Argentina’s Iberá wetlands in 2022 were a quiet win for the whole planet. Argentina was home to hundreds of thousands of jaguars when Europeans arrived in the 1400s—but centuries of hunting, deforestation and retaliation from ranchers has severely impacted the population of the largest feline in the Americas. Over the years, the animals slowly lost over 95 percent of their original range. Until finally, in the early ‘90s, donors and conservation experts came up with a solution: buy and protect a million acres of wetlands, help cultivate a local economy around nature-based tourism, rehabilitate the animals and release them back into the wild. Their plan is working.
There are now over 20 jaguars in Iberá National Park. And the jaguar cubs, Arandu and Jasy—the first to be born in the wild since the 1950s—are giving new hope that their growing population will help balance the entire ecosystem.
A biodiversity crisis around the world
Unfortunately, the jaguar’s endangerment in Argentina is just one small piece of a global problem. The current biodiversity crisis has threatened an estimated one million species across the globe, according to the United Nations, and sent populations of mammals, birds, fish, amphibians and reptiles plunging by an average of 68 percent between 1970 and 2016. But the one species most responsible for that loss is working harder than ever to make things right.
A series of ambitious new initiatives—including a new set of climate targets established at the 2023 UN Climate Change Conference (COP28) and a plan to conserve 30 percent of the world’s ecosystem by 2030—has put renewed pressure on people all around the globe to make a change. The challenge now is to identify which areas and species on land and sea are protected, determine what other places could be protected and decide where to prioritize our efforts in conjunction with other interrelated goals, like climate resilience and economic growth.
The key to tying together all that disparate information, and all of the various people involved, comes down to one thing: a map.
Visualizing the future of conservation
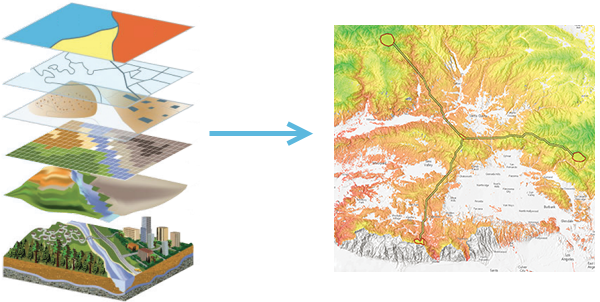
“You can hardly imagine doing conservation or planning work without a map,” said Jack Dangermond, founder and president of Esri—a global technology leader in mapping and geographic information systems (GIS)—at a recent Washington Post Live event. Dangermond says a well-designed map helps us envision better solutions to large- and small-scale problems, by “allow[ing] us to bring information together, overlay it, look at relationships and lay out ideas of the future for conservation.”
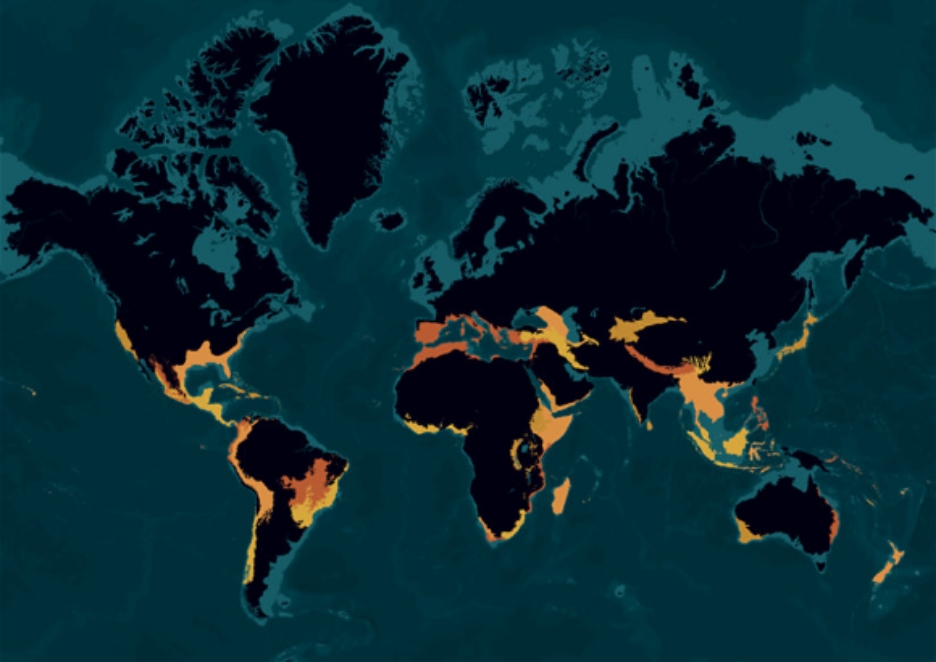
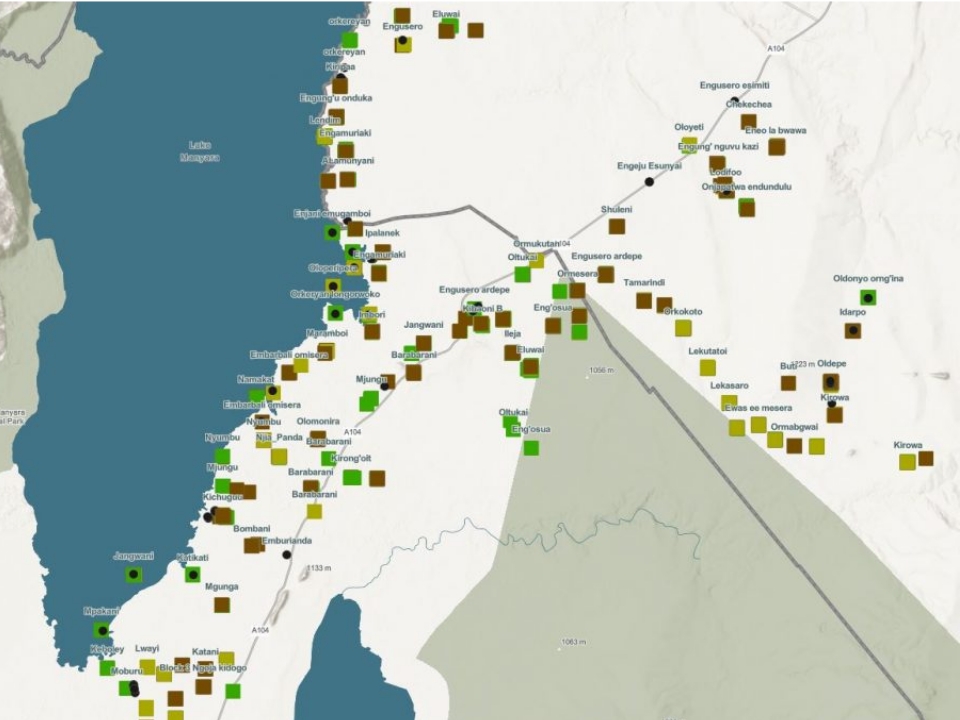
The yellow highlighting on this GIS map indicates significant levels of plant endemism and serious levels of habitat loss.
“GIS,” Dangermond added, “is the logical thing to organize all of this information and help us guide and build collaboration and communicate all of this information outwards.” Biodiversity loss weakens the physical and mental well-being of all species—and not just because healthy ecosystems provide us with air, water and food. They also provide protection from the worsening effects of climate change. In tropical environments especially vulnerable to flooding, for example, forests of mangrove trees help reinforce vulnerable coastlines, and provide natural carbon sinks that can absorb climate-warming carbon dioxide. “Keeping these geographies protected in various levels with rich biodiversity is very important for our existence,” Dangermond said.
Today scientists can tap into a profusion of data—from satellites, drones, sensors, cameras and mobile apps—to help track, in near real-time, the health of species and where intervention is needed most. Using GIS tools, biodiversity indicators can be mapped for thousands of species, along with their links within ecosystems, evolutionary histories and potential hazards. “We’re planning the future using these maps,” he said. “Some people in conservation call this data-driven conservation, and it’s happening at many scales.”
A springboard for action
Across the globe, comprehensive interactive maps are helping researchers, decision makers and the public visualize local and regional biodiversity threats and identify potential solutions. To chart progress—and the need for it—in the U.S., NatureServe and partners built the Map of Biodiversity Importance, considered the most complete map of biodiversity in the country. With field data from its network of over 1000 botanists and zoologists, collected through mobile apps, researchers were able to plot and predict the habitats of more than 2,200 species in previously under-analyzed regions all across the country.
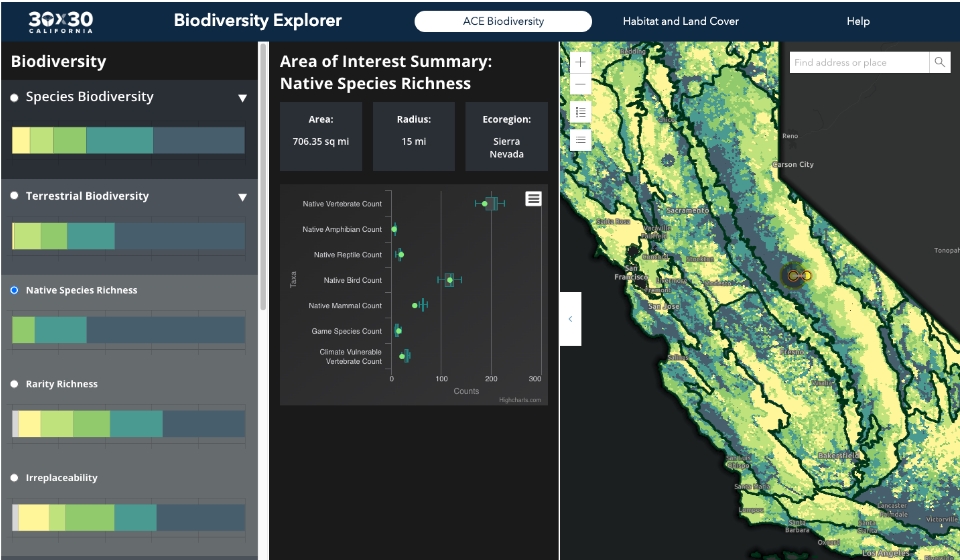
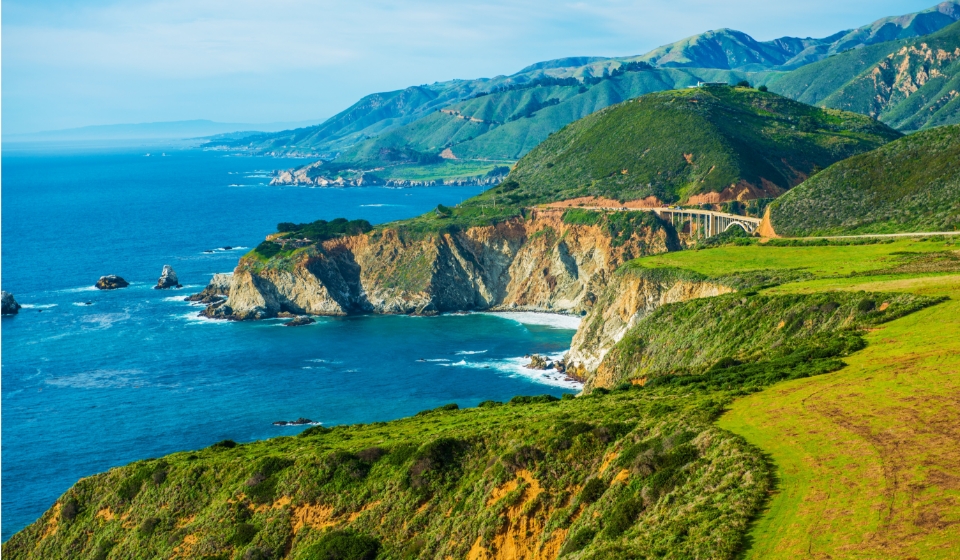
In California, where officials have pledged to bring an additional six million acres under conservation, the state’s Natural Resources Agency developed CA Nature, an interactive mapping hub to track local biodiversity and climate efforts across eight different types of landscape, from marine protections to working lands. Uniting a combination of data from state and federal agencies along with Esri’s ArcGIS Living Atlas of the World, the hub provides a foundation that policymakers, landowners and communities can use to implement their own conservation strategies. California boasts the country’s most abundant biodiversity, but the crisis doesn’t stop at its borders—a fact that conservation specialists emphasize when they call for greater collaboration across the map.
At a national scale, the Biden-Harris Administration has launched an initiative called America the Beautiful, which supports locally led conservation and restoration efforts across the country. The project, backed by a $1 billion public-private partnership, aims to integrate data, science, policy and community input through a map-based platform to help track conservation efforts.
This approach to closely monitoring the landscape and its wildlife is gesturing to a more futuristic idea, one born in industry and cities but no less applicable to nature. “A digital twin,” said Dangermond, “allows us to model [a landscape] with data.” The result, he continued, is “a living laboratory where we can do different aspects of science and share this science…and model it and see it halfway around the world in visualized map form.”
In cities like Prague, Paris and Singapore, the GIS-enabled digital twin is providing a critical form of modeling, according to Dangermond. “But in nature, we need to accelerate it, because it becomes an instrument for not just understanding science, but also interpreting science into applications,” he said.
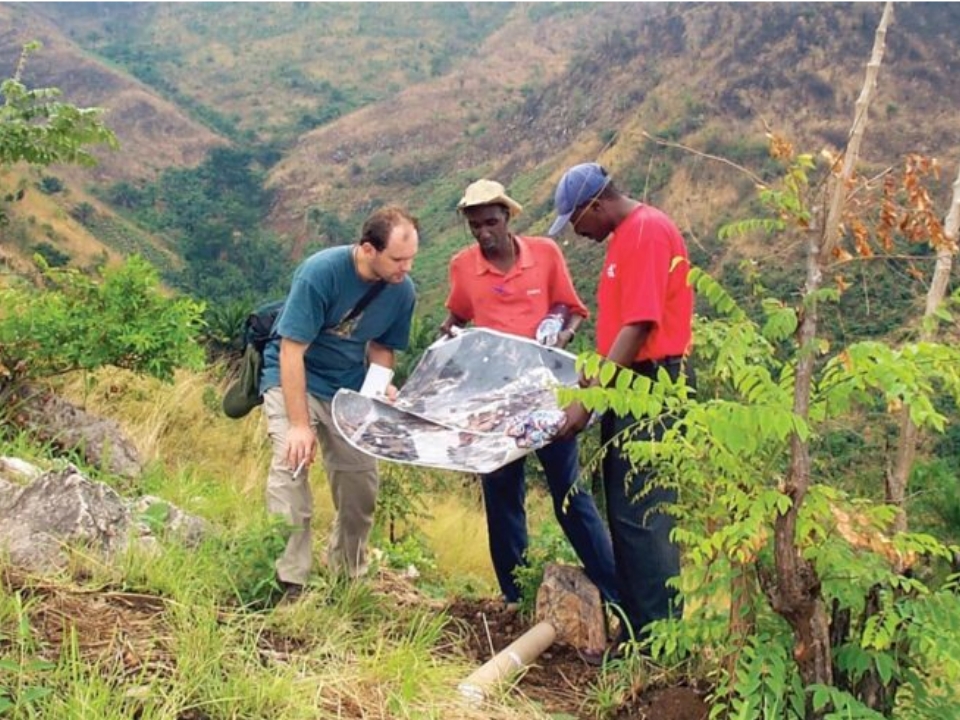
And in Tanzania—home to the most threatened biodiversity of any country on the African continent—conservation specialists rely on GIS not only to monitor anti-poaching efforts and cultivate sustainable agriculture but to work with local communities on building conservation plans from the ground up. There, as everywhere, that kind of collaboration is critical to the long-term health of ecosystems. As Argentina’s new jaguar cubs have proved, the work can pay off in massive ways.
“Look, everybody’s going to have to do everything they possibly can,” said Dangermond. “As a society at the global level, we have to realize we’re at a very fragile time. We need to move on conservation aggressively everywhere.”
