Living maps can help us understand our changing world—and take action
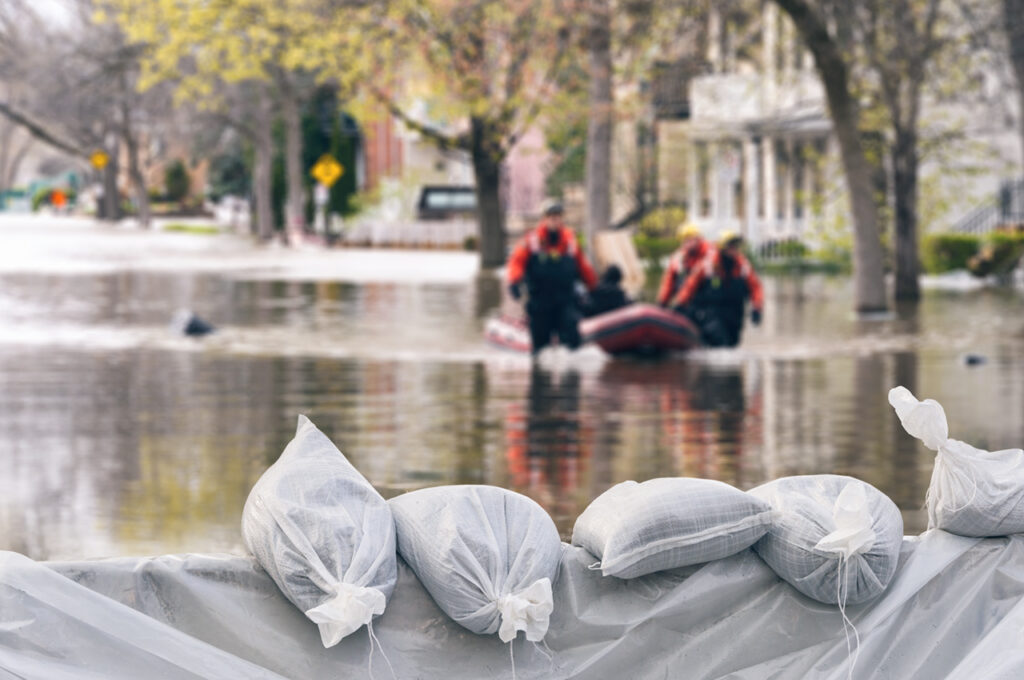
Natural disasters are becoming stronger and more frequent. Thankfully, new technology is springing up to meet the challenge.
By WP Creative Group
November 3, 2023
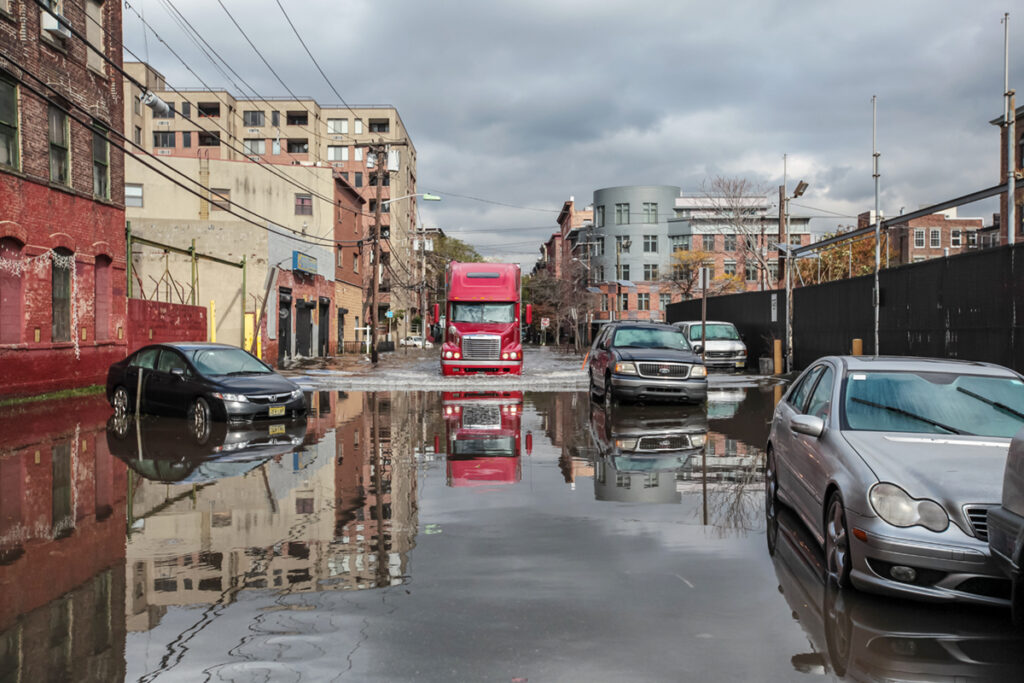
It was the Friday after U.N. Climate Week in New York City, and the effects of a fast-changing climate were on full display. The remnants of tropical storm Ophelia had combined into a surprisingly powerful deluge, triggering a state of emergency, shutting down subways and roads and leading officials to evacuate a hospital in Brooklyn after it lost power. For New York and every other place vulnerable to the life-altering impacts of climate change, the risks are increasingly inescapable. The question is, now what?
“Start with a map,” said Jack Dangermond, president of Esri, the world’s leader in geographic information system technology, or GIS. “Maps are a language and have been used as a language to both understand and also predict things for thousands of years,” Dangermond told audiences during a recent Washington Post Live event. “Now, those maps are becoming digital…This is helping people both understand and act in amazing ways.”
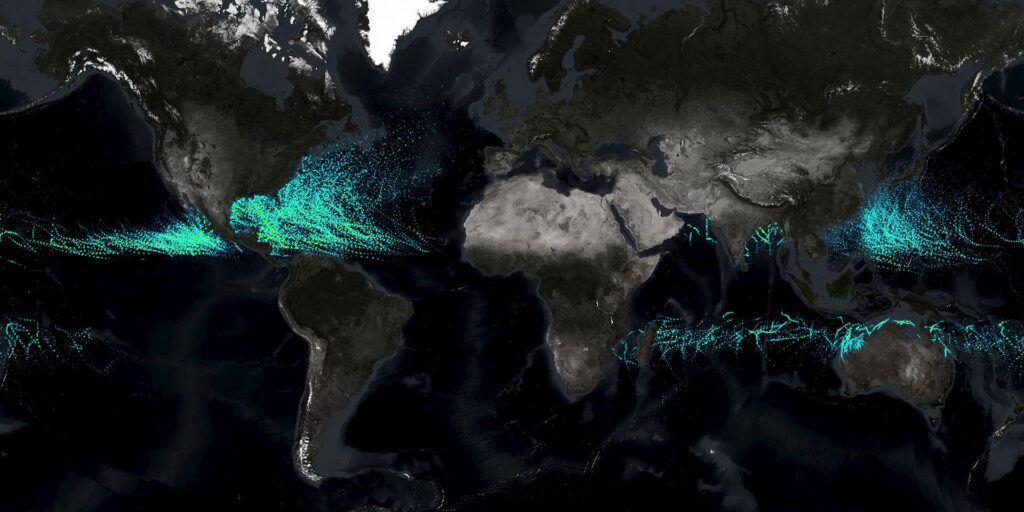
That geographic approach has never been more important than it is now, as we cope with one of the most pressing crises of our time. And with a growing wealth of next-generation data and advances in artificial intelligence, the maps have never been richer or more real-time. Just as satellites and computing once revolutionized global weather forecasting, space observation and land-based sensors covering every bit of Earth’s surface gather data crucial for envisioning ongoing changes to climate and biodiversity—and for visualizing our impacts on the planet. “In the digital age, these maps are alive,” Dangermond said.
Dangermond has seen the power of data-rich maps accelerate and become transformative. He and his wife Laura launched Esri as a land-use consultancy in 1969, around the dawn of the modern environmental movement. Now, hundreds of thousands of government agencies, companies and institutions across the globe use Esri’s cloud-based geospatial software, ArcGIS. “[GIS tools] are helping [communities] understand where we should not locate, like in a floodplain or in an area that’s going to have storm surge,” he said. Those same GIS tools helped a global shipping courier route trucks more efficiently, saving millions of dollars. By plotting weather and climate projections, farmers are looking years in the future and saying, “I can’t grow corn here anymore, I’ve got to move north,” Dangermond continued.
When it comes to mitigation and adaptation on a larger scale, however, coherent strategies are often lacking. “Last week I spent time with a number of U.S. senators,” recalled Dangermond, “and one of them simply said, ‘Jack, we need a strategy for climate.’ We really need to strengthen how we think about it and how we design our way out of this.”
After the Biden-Harris Administration committed $44 billion in 2021 to climate-related projects through the Inflation Reduction Act, officials turned to GIS to figure out how best to invest that money, based on the highest need. That would be determined according to a set of overlapping principles that call for 40 percent of funds to go toward historically disadvantaged communities.
To help communities apply for funds and prepare for climate-related disasters, in July 2021 the White House released the Climate Mapping for Resilience and Adaptation (CMRA) portal. The CMRA, or “camera,” uses interactive maps to illustrate the ongoing impacts of climate-related disasters, as well as 30 years of historical data and predictions for the next 30 years. Additional data layers—on population, demographics, the built environment, even building-code data—help local and federal agencies focus their funding applications and resilience efforts. And maps like CMRA are driving home the threat to the public in new ways, letting anyone anywhere see what climate change will do to their towns.
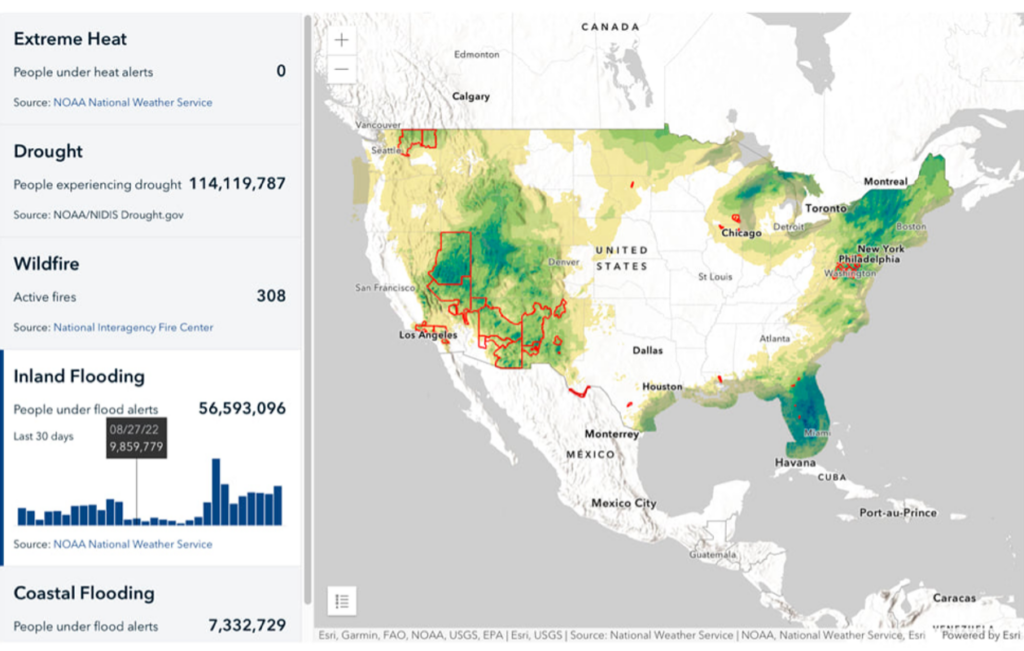
“For decision-makers grappling with torrents of data and competing agendas, GIS can be a powerful common ground,” Dangermond said. By extracting data out of disparate spreadsheets and plotting it alongside information on ecosystems, economies and demographics, maps help expose hidden risks or answer novel questions—not only which places are most likely to suffer extreme heat, but which regions are most vulnerable, and hence where to invest billions in new funding. By uniting planners around a single platform, maps are also helping shape new policies and verifying that money is well-spent.
Cities around the world are already wielding GIS to battle a litany of climate hazards. After a heatwave swept across Europe in 2015, breaking heat records in cities across the continent, officials in Prague decided their city needed to better understand the impacts of a rapidly shifting climate. Using GIS, city planners built “digital twins” of certain neighborhoods: geographically-accurate 3D models based on imagery, real-time and historical climate information, and layers of climate and sociological data. The system allows planners and researchers to visualize problems block-by-block, identify cost-effective solutions like trees and green spaces, and then assess their effectiveness. By presenting data to decision-makers and the public in a way that’s intuitive, visually pleasing and useful, the system prioritizes science over anecdotes and opens the door to more public participation.
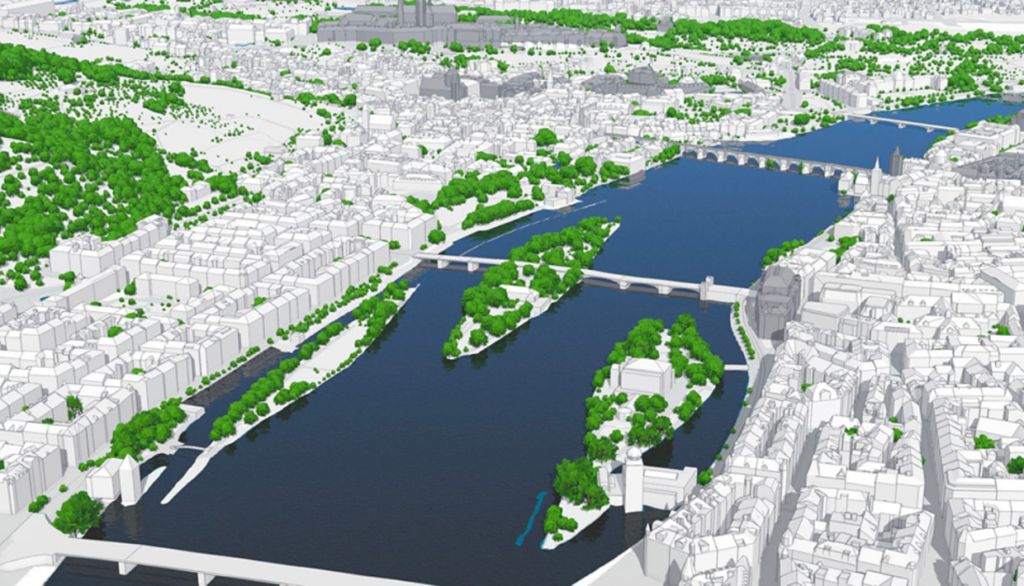
Similar simulations are providing near real-time insights on climate-related impacts in cities like Paris, Singapore, Boulder and Los Angeles. And in flood-vulnerable New York, data-rich maps are helping city planners determine not just where to place new pumping stations but how to rethink the entire streetscape, under a multi-billion dollar initiative to replace asphalt and pavement with green spaces or infrastructure that’s designed to sop up excess rain.
“Battles over politics and science—clouded further by a flood of data—make digital maps even more crucial. For a crisis that doesn’t care about political borders, it’s imperative that that kind of thinking and collaboration around climate extends across the globe,” Dangermond continued. GIS can transcend the political polarization that fractures us, by offering a way to view our world that’s “grounded in the basic science of geography,” added Dangermond.
Sometimes, Dangermond dreams of a single map of the world, illustrating in real-time how its interlocking connections impact and are impacted by a dynamic climate. A map that would let researchers, decision-makers, and the public more quickly model scenarios, pinpoint risk and adapt to a shared challenge.
In many ways, his dream is already here. “This idea that people can see things and collaborate and create solutions together,” Dangermond said, “this is what encourages me.”
