The hero we’ve been waiting for is actually a map
A geographic information system (GIS) distills complex data into digestible maps, empowering decision makers to address issues from climate impacts to landmine clearance to retail strategy.

By WP Creative Group
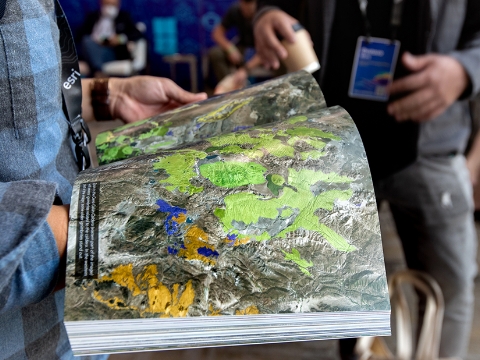
From hand-inked parchments to wayfinding apps, maps have helped us understand where we are for thousands of years. Today, high-tech maps do so much more, helping us address challenges, from tracking pandemics to managing supply chains and battling wildfires to strategizing whole new industries.
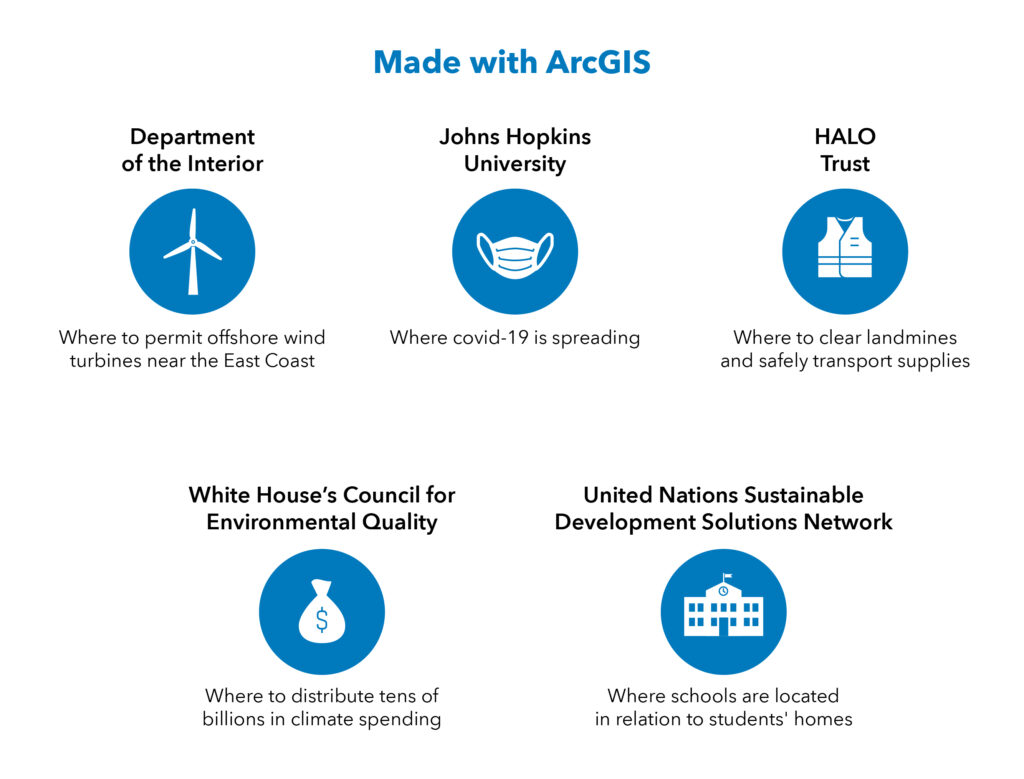
When officials at the Department of the Interior needed to figure out where to permit offshore wind turbines near the East Coast, they turned to GIS. There were multiple factors to consider—transportation routes, local ecosystems, coastal community needs, wind strength, ocean views and accessibility to onshore infrastructure. With help from the National Oceanic and Atmospheric Administration, the agency’s analysts diligently mapped to identify the optimal spots for the towering turbines. In February 2022, the United States began auctioning wind rights off the coasts of New York and New Jersey, bringing in a record windfall for taxpayers: $4.37 billion. The maps paid off.
American off-shore wind “is a new industry that’s taking off,” said David Hayes, who was former deputy secretary of interior under President Obama and now serves as special climate advisor to President Biden. “It’s getting a good start because of good mapping.”
Why the where?
GIS mapping is used to build billions of sophisticated maps, combining big data, artificial intelligence and an ecosystem of apps to bring a place-based approach to the world’s thorniest problems. By analyzing and integrating streams of location data, GIS helps expand our understanding by visually communicating ideas to everyone, from the executive to the project manager to the citizen.
Covid-19 and its crises have exacerbated many of our global challenges, from health inequities to fragile supply chains. The pandemic has also underscored the power of a good map.
“Most of the time health data takes two or more years to get out there, and it gets put out on a PDF where nobody can use it,” said Este Geraghty, chief medical officer at Esri, which makes the software that powers much of the world’s geographic knowledge. In January 2020, Ensheng Dong, a graduate student at Johns Hopkins University, along with his advisor Dr. Lauren Gardner, fed covid-19 data into an Esri dashboard, creating a global pandemic map which he updated regularly. The page quickly became the most viral map-based application in history. Geraghty says it’s since been viewed over a trillion times.
“I truly believe it’s the most valuable data set ever created,” Geraghty said. “The whole world looked at that data and they were able to get answers.”
If we’ve been taking maps for granted, perhaps it’s because we’ve been using them for so long. “If you look back thousands of years, you see how mapping has co-evolved with civilization,” said Jack Dangermond, Esri’s president and founder, speaking on the sidelines of the company’s User Conference, the GIS industry’s biggest event, held in July in San Diego. “With advances in mapping, civilization has advanced. How do we organize land? How do we organize administrative boundaries? How do we navigate? How do we discover? These examples all provide the evidence.”
Many more examples filled the waterfront convention center during the Esri User Conference where thousands of data scientists, geographers, map-makers and decision makers gathered to hear keynotes and talks, discuss innovations and, in a grand, sunlit showroom, show off their new maps. With users from nearly every country and industry, the conference is a lively cross-section of civilization, all linked by GIS. Speaking on this year’s conference theme, “Mapping Common Ground,” Dangermond emphasized the ways GIS can help build a shared understanding of the world.
“The central problem of our time is a lack of understanding and a failure to collaborate,” he said. “Mapping and the geographic approach are powerful means for creating understanding, exploring alternatives, finding solutions and reaching agreements…and ultimately, mapping the future we want to see.”
If you look back thousands
Jack Dangermond, Esri’s president and founder
of years, you see how
mapping has co-evolved with
civilization.
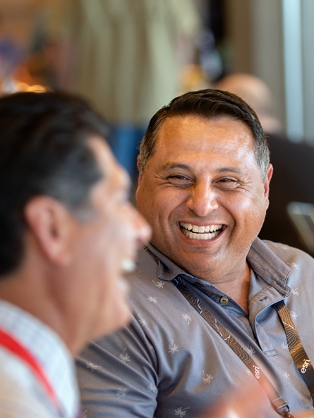

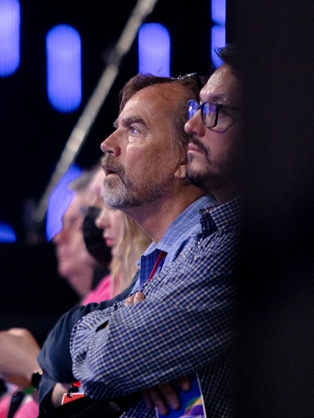
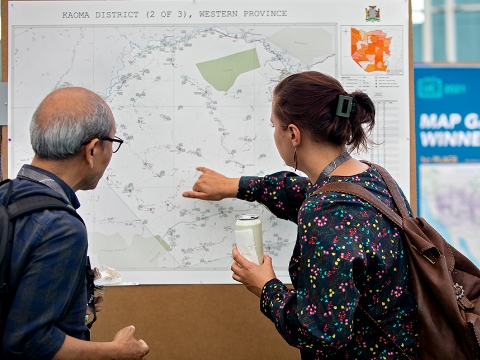
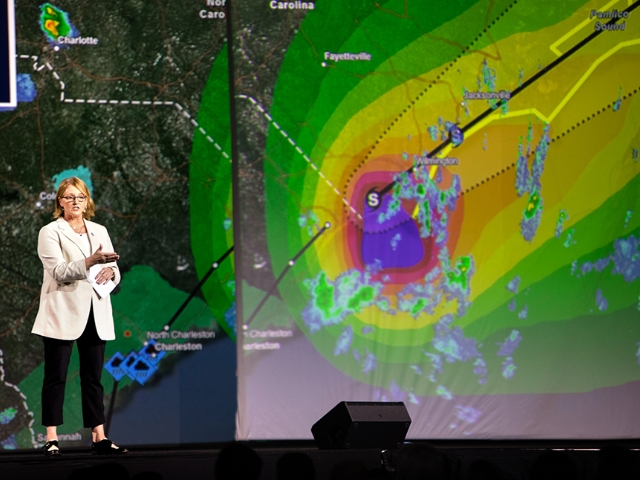
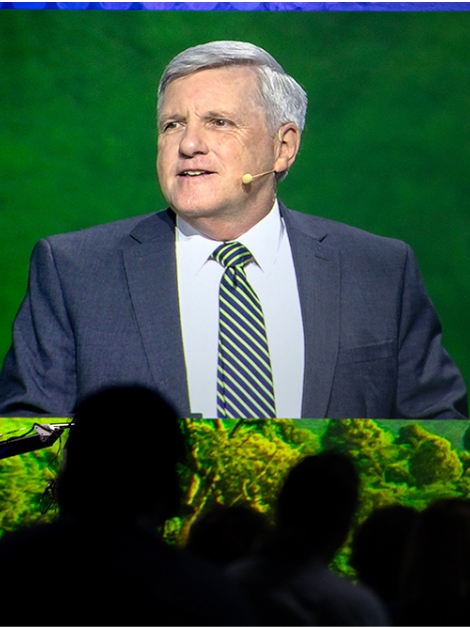
Scenes from the 2022 Esri User Conference
The power of mapping now
There’s a where in every problem, but dynamic, data-rich maps are helping answer a world of other questions. Municipalities use GIS to see growth and adjust infrastructure. Companies like UPS monitor changes in roads and use GIS analysis to plot the paths of packages, just as major retailers use knowledge of urban development to plot future store locations. During an Esri User Conference demonstration, engineers showed how they use Esri software to track construction of new Paris metro lines in near real-time and 3D. They presented a schematic digital twin of every station, building and pipe, both above and underground, like a kind of infrastructure metaverse.
For HALO Trust, the world’s largest humanitarian landmine clearance and weapons disposal organization, the stakes of employing GIS couldn’t be higher.
“You really have to be thorough with your work,” said Jesse Hamlin, the group’s chief geospatial officer. He and a global contingent of local staff use sophisticated GIS to map landmines and unexploded bombs using open-source data and satellite imagery. Since it was founded in 1988, HALO reports clearing over 14 million landmines and unexploded ordnances in over two dozen countries. In Ukraine, analysis of war-scarred landscapes not only helps guide the survey and clearance of landmines, but also helps identify safe zones and new routes for humanitarian supplies.
GIS also helps FEMA, the Red Cross and other humanitarian responders better deploy in the aftermath of disasters by coordinating a network of first responders, supplies and feeds of raw data from drones and social media. In California, fears of future disasters have led the Natural Resources Agency to enlist communities in a state-wide mapping project, helping locate places that can be more sustainably protected or managed. By 2030, the state aims to conserve 30% of its lands and waters, which thousands of species found nowhere else call home.
The applications of GIS mapping are nearly endless. Government specialists use GIS software to track the interplay of local militias and where explosions happen in real-time, while scientists use unclassified versions of the same technology to trace the migration pathways of birds and other wildlife. Sophisticated AI-enriched maps are helping to upgrade the fight against wildfires and track global methane and carbon dioxide emissions to shape climate action. As part of a public-private partnership in Georgia and other states, GIS mapping is helping localities find disused stretches of public highway ideal for new electric vehicle stations, broadband and other future infrastructure.
An engine for innovation
Dangermond believes the multidisciplinary, collaborative approach of GIS—there are 50 million shared data sets and services on Esri’s platforms—can enhance understanding of an endless flood of complex problems, especially amid seemingly infinite data. Dangermond estimates he invests a third of Esri’s earnings into research and development each year, adding functionality such as game engine integration and solutions to address pressing challenges, such as biodiversity decline or the housing crisis.
Maryam Rabiee, manager at the United Nations Sustainable Development Solutions Network, says new ideas emerge when abstract problems are humanized, which is why she relies on mapping.
Rabiee’s team makes digital maps to show critical data in ways that go far beyond a chart or a spreadsheet. She’s helped make dynamic maps of global broadband access by gender and of covid-19’s disparate impacts on communities across the United States. With a good local map, she said, citizens “can hold policy makers accountable, ask the right questions and demand attention for the gaps that exist.”
[With a good local map, citizens] can hold policy makers accountable, ask the right questions and demand attention for the gaps that exist.
Maryam Rabiee, manager at the United Nations
Sustainable Development Solutions Network.
Her team’s newest dashboard, a first-of-its-kind map of the schools across the African continent, lets anyone see estimates of students’ walking travel time, age populations, gender and other data for any given locality. Built with data from Open Street Map and Esri’s Living Atlas, a repository of geographical and demographic data, the maps allow communities to add in their own data. Rabiee and her team included multilingual how-to guides and a link to Esri’s Survey123, an app that lets users send in information from their phones.
“Absolutely, this is one of my favorite tools,” she said of Survey123. “We need the community to map their schools because governments can’t do this on their own.”

Mapping the future
Maps can help illustrate exciting futures, and even the sobering ones can reveal unseen possibilities and inspire action. The White House’s Hayes recalled a meeting in July 2022 with governors, wind energy industry leaders, labor leaders and administration officials which demonstrated the power of maps and associated graphics. In simple colors and lines, a map showed the communities up and down the east coast that are already hosting new manufacturing and facilities for the new American offshore wind power industry, which by 2030 is projected to produce 30 gigawatts of clean energy, support 77,000 jobs and spur $12 billion a year in private investment. An accompanying graphic displayed how new offshore wind turbines are approaching the height of the Eiffel Tower. The President was particularly impressed.
“Those were great maps and graphics,” Hayes said, “just to demonstrate the size of the growth opportunity here, which is amazing.”
That growth can’t come soon enough. The people along the coast who stand to benefit most from offshore wind are also some of the most vulnerable to rising seas. To more effectively address the inequitable impacts of climate change, the White House’s Council for Environmental Quality assembled a map-powered screening tool, now in beta. The tool lets policy makers across the administration understand how certain localities fare on over a dozen factors to more equitably distribute tens of billions in climate spending to the communities predicted to be most imperiled.
For all of the forecasting, Hayes said the value of a good map is in the present: uniting the various people and disciplines needed to fight a problem. The National Oceanic and Atmospheric Administration, Environmental Protection Agency and Department of Health and Human Services are now collaborating on climate change using extreme heat maps. “They’ve never worked together before on this serious new climate threat,” he said.
Hayes calls this kind of collaborative approach “a new muscle” that’s necessary for addressing the world’s biggest problems. “It’s being built right now,” he said, “and GIS mapping helps.”

Learn more about how Esri’s GIS technology helps solve some of the world’s most complicated issues.
Credits: By WP Creative Group